
For a list of BASHing data 2 blog posts see the index page. ![]()
Mapping with gnuplot, part 5
In part 4 of this series I showed an improved method for generating a basemap with gnuplot. This post demonstrates a script I use (called "splot") to plot species distributions on a basemap of Tasmania.
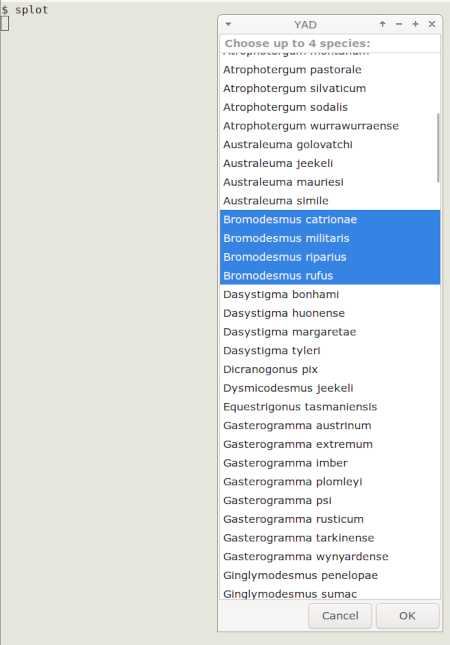
I launch the command from a terminal with "splot". A YAD dialog window appears from which I can select up to four species names, using Ctrl for multiple selections:
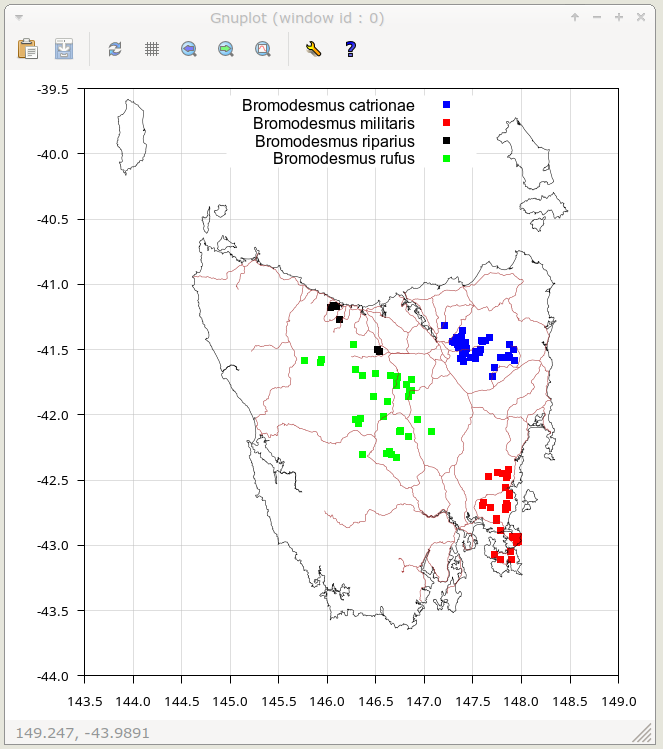
When I click "OK" or press Enter, a gnuplot window appears with a plot on the basemap of localities for the selected species. The particular terminal window I use (wxt) allows me to read off the coordinates under a mouse-driven cursor. Entering "q" dismisses the map window and returns me to the command line.
The "splot" script depends on four plain text files, all located in my ~/Millipedes_new directory and highlighted below. The basemap has a polygon file of Tasmania ("tas3") and a major roads multiline file ("roads3"), built as described in part 4 of this series.
The data file with species occurrences is "Tasmanian_millipede_records.txt" and it has 45 fields. The fields used in the script are scientificName (field 5), decimalLatitude (27) and decimalLongitude (28).
The fourth text file is "millist", which is the list of species names to be displayed by YAD. While a list of names could also be pulled directly from "Tasmanian_millipede_records.txt", I prefer to have a shorter, separate names list that leaves out the taxonomic authority and year (as in "Lissodesmus perporosus Jeekel, 1984") and some uncertain identifications.
Here's how the script works:
cd ~/Millipedes_new
Change directory to the one with the needed text files.
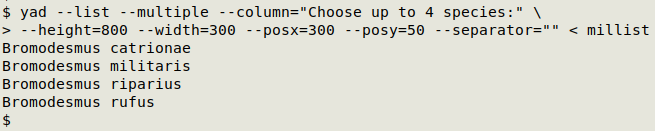
choices=$(yad --list --multiple --column="Choose up to 4 species:" --height=800 --width=300 --posx=300 --posy=50 --separator="" < millist')
Store in the variable "choices" the output from the YAD dialog command, which is a simple list of names:
choice1=$(sed -n '1p' <<<"$choices")
choice2=$(sed -n '2p' <<<"$choices")
choice3=$(sed -n '3p' <<<"$choices")
choice4=$(sed -n '4p' <<<"$choices")
Define four new variables, one for each of the listed names in "choices"
awk -F"\t" -v abbr1="$choice1" '$5 ~ abbr1 {print $28 FS $27}' Tasmanian_millipede_records.txt | sort | uniq > /tmp/toplot1
Use AWK to build a temporary plotting file "/tmp/toplot1" for the first choice on the list. I always choose at least one species for plotting; if I don't and there's no YAD output, gnuplot plots all the records in 'Tasmanian_millipede_records.txt', which is sometimes a useful map to see!
AWK looks for entries in the scientificName field of "Tasmanian_millipede_records.txt" that match the selected short version of the name, then prints decimalLongitude (x value) and decimalLatitude (y value) from those records, tab-separated and ready for gnuplot plotting. sort and uniq are used here to remove any duplicate coordinate pairs for the selected species.
if [ -n "$choice2" ]; then
awk -F"\t" -v abbr2="$choice2" '$5 ~ abbr2 {print $28 FS $27}' Tasmanian_millipede_records.txt | sort | uniq > /tmp/toplot2
fi
The three "if" sections build more temporary plotting files, but only if the additional name choices have been made.
gnuplot 2>/dev/null
The gnuplot command starts with 2>dev/null to delete the error messages I'll get if there are fewer than four species chosen.
rm /tmp/toplot*
Deletes the temporary plotting files.
Putting the gnuplot command inside the "splot" script saves the trouble of maintaining a separate configuration file for the mapping.
#!/bin/bash
cd ~/Millipedes_new
choices=$(yad --list --multiple --column="Choose up to 4 species:" --height=800 --width=300 --posx=300 --posy=50 --separator="" < millist')
choice1=$(sed -n '1p' <<<"$choices")
choice2=$(sed -n '2p' <<<"$choices")
choice3=$(sed -n '3p' <<<"$choices")
choice4=$(sed -n '4p' <<<"$choices")
awk -F"\t" -v abbr1="$choice1" '$5 ~ abbr1 {print $28 FS $27}' Tasmanian_millipede_records.txt | sort | uniq > /tmp/toplot1
if [ -n "$choice2" ]; then
awk -F"\t" -v abbr2="$choice2" '$5 ~ abbr2 {print $28 FS $27}' Tasmanian_millipede_records.txt | sort | uniq > /tmp/toplot2
fi
if [ -n "$choice3" ]; then
awk -F"\t" -v abbr3="$choice3" '$5 ~ abbr3 {print $28 FS $27}' Tasmanian_millipede_records.txt | sort | uniq > /tmp/toplot3
fi
if [ -n "$choice4" ]; then
awk -F"\t" -v abbr4="$choice4" '$5 ~ abbr4 {print $28 FS $27}' Tasmanian_millipede_records.txt | sort | uniq > /tmp/toplot4
fi
gnuplot 2>/dev/null <<EOF
set term wxt size 650,650 position 300,100 persist
set size ratio 1.1
set style line 1 lc rgb "gray" lw 0.5
set style line 2 lc rgb "black" lw 0.5
set style line 3 lc rgb "brown" lw 0.5
set format x "%0.1f"
set format y "%0.1f"
set xrange [143.5:149.0]
set yrange [-44.0:-39.5]
set xtics 0.5
set ytics 0.5
set tics nomirror out font "Sans, 10"
set grid linestyle 1
set key top center font "Arial, 12"
plot "/tmp/toplot1" with points pt 5 lc "blue" ps 1 title "$choice1"
replot "/tmp/toplot2" with points pt 5 lc "red" ps 1 title "$choice2"
replot "/tmp/toplot3" with points pt 5 lc "black" ps 1 title "$choice3"
replot "/tmp/toplot4" with points pt 5 lc "green" ps 1 title "$choice4"
replot "tas3" with lines linestyle 2 notitle
replot "roads3" with lines linestyle 3 notitle
EOF
rm /tmp/toplot*
exit
Last update: 2024-03-15
The blog posts on this website are licensed under a
Creative Commons Attribution-NonCommercial 4.0 International License