For a full list of BASHing data blog posts see the index page. ![]()
The myth of equinoctial gales
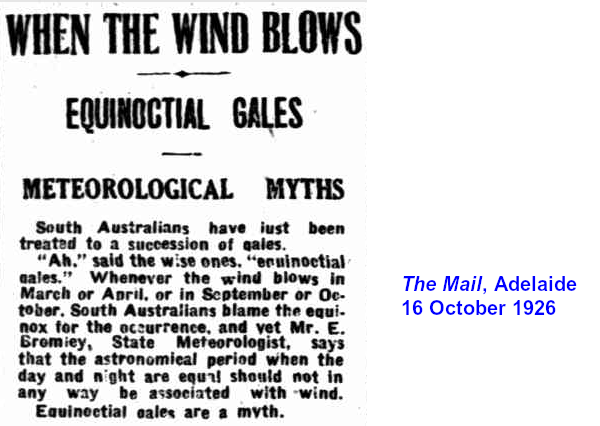
Image from Trove, the Australian national digital library.
In 2020, "wise ones" here in Tasmania still talk about equinoctial gales. Belief in the coincidence of strong winds and the equinoxes is handed down from generation to generation and reinforced by selective memory. Equinoctial gales have the same durability in local folklore as Rain before seven, fine by eleven and If the moon comes in wet, it'll be wet for a fortnight. Both of these sayings, typically prefaced with "They say...", are nonsense but are commonly repeated.
I wanted to get some local, long-term wind data for analysis: when do gale-force winds blow during the year in Tasmania? Do they regularly appear around the equinoxes? Alas, I ran up against a paywall. Australia's Bureau of Meteorology makes large volumes of weather data freely available from individual recording stations, but the wind data product I was after was priced at AUD$99 for "cost recovery".
Schiphol. I looked online for free wind data, preferably from places without hurricane seasons. The best raw-data source I found was the Royal Netherlands Meteorological Institute (KNMI). From the KNMI website I downloaded some wind data from Schiphol, where Amsterdam has its airport.
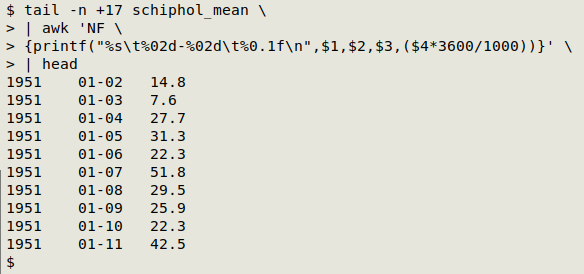
One of the datasets is daily mean wind speed in meters per second. I downloaded the plain-text data file (for 1951-01-02/2020-09-21) and renamed it "schiphol_mean". The first 16 lines were headers, the data items were separated with variable numbers of spaces and the last line was blank. I reformatted the data lines as year[tab]DD-MM[tab]speed in km/hr using the command shown below (explained at end of blog post):
tail -n +17 schiphol_mean \
| awk 'NF {printf("%s\t%02d-%02d\t%0.1f\n",$1,$2,$3,($4*3600/1000))}'
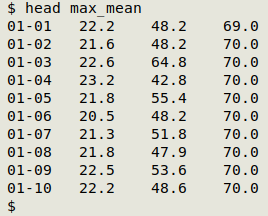
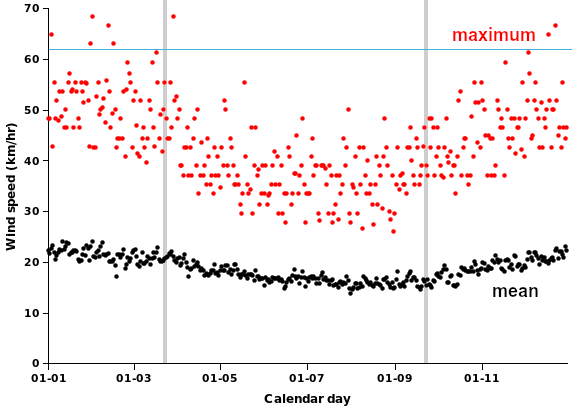
I fed the result of this command to GNU datamash to get the mean daily mean windspeed for each calendar day, the maximum, and the number of years checked, saving this in the tab-separated file "max_mean" with output rounded to 1 decimal place:
tail -n +17 schiphol_mean \
| awk 'NF {printf("%s\t%02d-%02d\t%0.1f\n",$1,$2,$3,($4*3600/1000))}' \
| datamash --sort groupby 2 mean 3 max 3 count 3 -R 1 > max_mean
The graph below shows how the mean and maximum values of the daily mean wind speed track through the year. November through February is the the windiest period for both the mean and maximum, and the equinox periods (equinox days marked with gray bars) are "middling windy", on average. The thin blue line marks a commonly used threshold for gale-force wind, 62 km/hr.
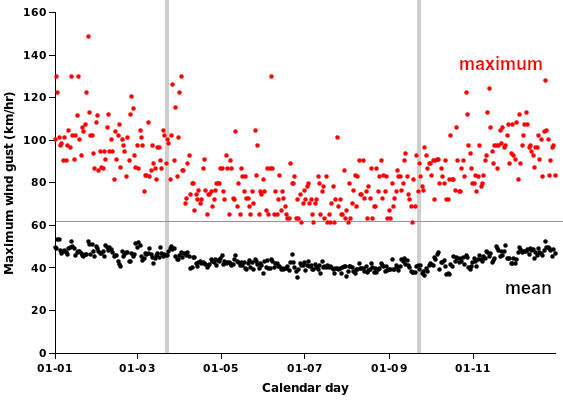
The second KNMI dataset I looked at was daily maximum wind gust (1971-01-01/2020-09-21); I renamed the downloaded file "schiphol_max". The file was structured the same way as the mean daily windspeed file, so I repeated the commands shown above with "schiphol_max" to create "max_max". Here's a plot from "max_max", showing much the same seasonal pattern as mean daily wind speed, and no equinoctial peaks:
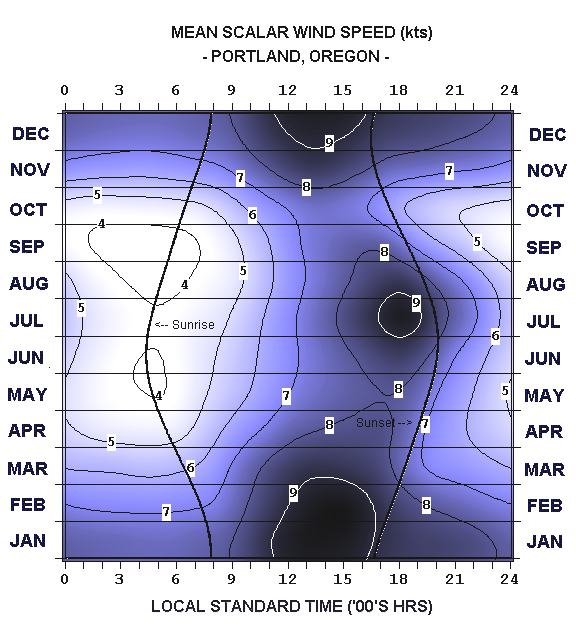
Portland. Like Tasmania, the city of Portland in western Oregon has a temperate oceanic climate with wet, cool winters and dry, warm summers. On the climatestations.com website maintained by US meteorologist Charles Fisk there are a couple of fascinating graphics with summarised Portland wind data. (Graphics reproduced here with permission). The first graphic (below) shows both daily and seasonal variation in mean wind speed ("scalar" means non-directional). The peaks are midwinter and midsummer, in the afternoon:
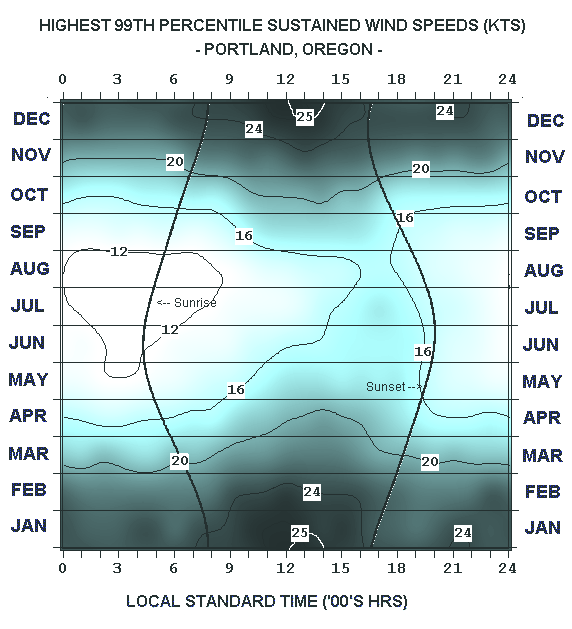
The second graphic shows a broad wintertime peak in very strong winds, just as at Schiphol:
So... You're welcome to say that strong winds blowing around the equinoxes are the well-known "equinoctial gales". Be sure to add that strong winds blowing around the solstices are the "solstitial gales", and any strong in-between winds are the "in-between gales".
tail -n +17 schiphol_mean \
| awk 'NF {printf("%s\t%02d-%02d\t%0.1f\n",$1,$2,$3,($4*3600/1000))}'
The first 16 lines of "schiphol_mean" (the header lines) are clipped off with tail. The beheaded file is piped to AWK, which operates only on the non-blank lines because of the condition "NF". That's AWK shorthand for "NF != 0"; in a blank line the number of fields "NF" is zero.
In this particular case, AWK doesn't need to be told what the field separator is, because AWK's default field separators are one or more spaces, and that's what separates the data items in "schiphol_mean" (none of the items contain spaces).
AWK's only action is to reformat each line with printf. The first field ($1) is year, which is formatted as a plain string followed by a tab (%s\t). The second and third fields ($2, $3) are month and day numbers. These are printed with leading zeroes and separated by a hyphen, then followed by another tab (%02d-%02d\t). The fourth field ($4) is wind speed in meters per second. This is converted to kilometres per hour ($4*3600/1000), rounded to one decimal place and followed by a newline (%0.1f\n).
Last update: 2020-10-14
The blog posts on this website are licensed under a
Creative Commons Attribution-NonCommercial 4.0 International License