For a full list of BASHing data blog posts see the index page. ![]()
Life tables
I know I'll die, sooner or later, but how many years do I have left?
There's no answer to that question for me or for anyone else interested in their future, because the future is unknowable. That hasn't stopped demographers and actuaries from calculating life expectancies in years and sometimes making news with their calculations.
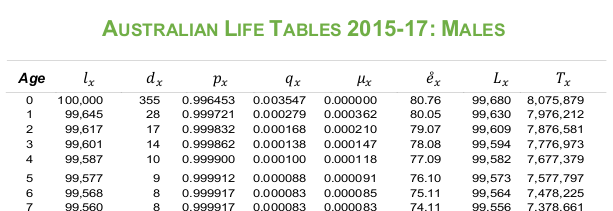
Here in Australia the Government Actuary produces Life Tables every 5 years. The tables are based on enumeration. How many 60-year-old women were there at the last Census? How many 60-y-o women died around the Census time? From those numbers (and others) the Actuary can calculate a current likelihood of dying and an expected number of years before death for 60-y-o women.
Tallying population and death totals isn't straightforward and adjustments are made to both the current male and female populations at each age, and to the death numbers. The population figures in the latest Life Tables were adjusted from the 2016 Census, and the death figures cover the 3 years 2015-2017.
Those latest Life Tables are freely available online in a PDF and as downloadable Excel files. (Yes, Excel files, not CSVs. The Australian Government just loves Microsoft.)
Building a tab-separated text table. I took life table data from the PDF because I couldn't be bothered extracting figures from the Excel files and then rounding off the Actuary's exuberant calculations. For example, in the males Excel table the number of survivors at age 4 out of 100,000 is said to be 99587.01831614994 individuals, and those toddlers can expect to live another 77.092168773058 years, on average. That's a precision of about 0.03 milliseconds.
The number of decimal places depends on how the program converting from Excel handles floating-point numbers. Survivorship of 4-y-o's is 99587.01831615 in LibreOffice Calc (and with LibreOffice "headless"), 99587.01831614994 in Gnumeric and with in2csv from the "csvkit" tools package, and 99587.018316 with the xlsx2csv utility.
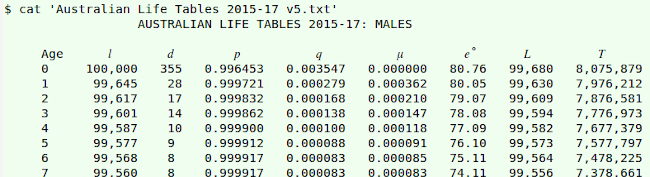
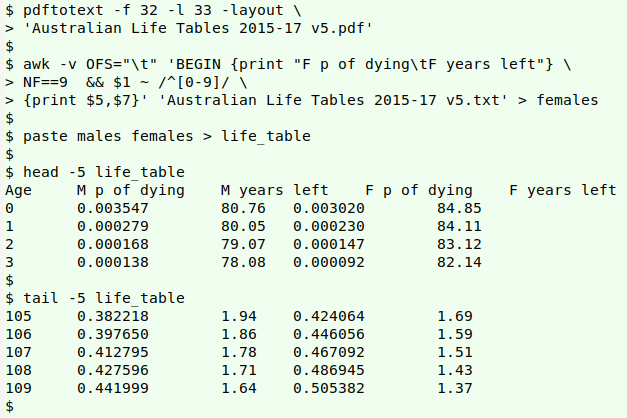
There's an excellent command-line tool to extract text from PDFs called — logically enough — pdftotext. The males life table is on pages 30 and 31 of the PDF (numbered pages 24 and 25), so I applied the pdftotext options -f 30 and -l 31 ("f" for "first page", "l" for "last page"). I also used the -layout option, to preserve the table arrangement. The next screenshot shows the top of the males table as it appears in the PDF:
The output of the command pdftotext -f 30 -l 31 -layout 'Australian Life Tables 2015-17 v5.pdf' is the spaces-separated text file 'Australian Life Tables 2015-17 v5.txt', the top of which looks like this (terminal screenshot reduced in size):
Notice that the header line in the table is missing the character subscripts, but that's not a problem. The 3 fields I wanted were 1, 5 and 7, which are:
- current age
- "the probability of a person aged exactly x dying before reaching age ( x + 1)"
- "the complete expectation of life (that is, the average number of years lived after age x) of persons aged exactly x"
The relevant lines in the text-from-PDF file all have 9 fields and begin with a number, so the following AWK command gave me just the "Age" lines, with tab-separated fields. I saved the AWK output as the text file "males":
awk -v OFS="\t" 'BEGIN {print "Age\tM p of dying\tM years left"} NF==9 && $1 ~ /^[0-9]/ {print $1,$5,$7}' 'Australian Life Tables 2015-17 v5.txt'
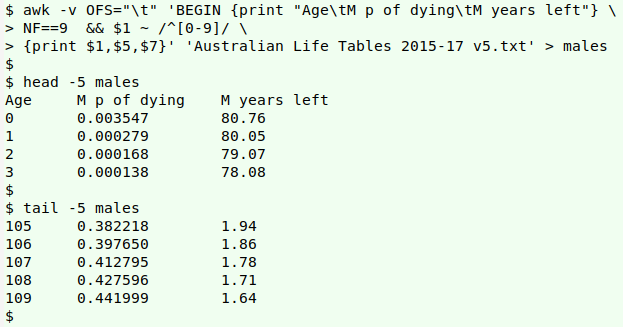
AWK interprets a sequence of spaces as a field separator, so I didn't have to define the input field separator, just the output one, a tab (-v OFS="\t"). The spaces before the first field aren't counted by AWK as a field separator.
I repeated the process for the females life table on PDF pages 32 and 33, but this time left out field 1 when building "females". I then pasted "males" and "females" together to make "life_table":
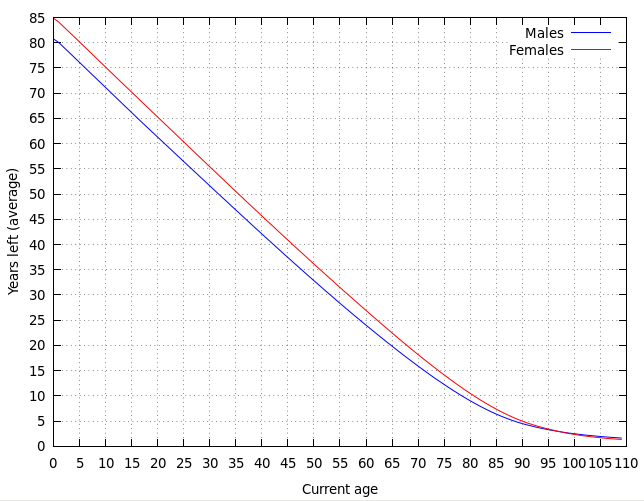
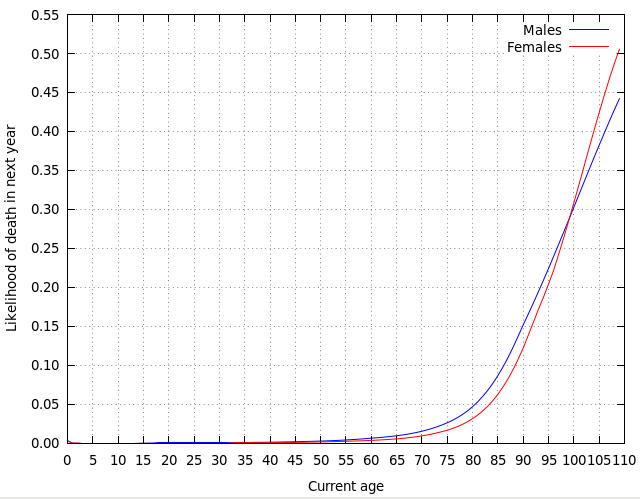
Plotting the selected data. To graph my "life_table" I turned to gnuplot. The Actuary estimates that Australian men my age have another 13 or so years to live, on average, and our chances of dying in the next year are a little over 2%.
config1:
set term wxt size 650,500 enhanced font "Sans,10" persist
set border lw 1
set style line 1 lc rgb "blue" lw 1
set style line 2 lc rgb "red" lw 1
set format x "%0.f"
set format y "%0.f"
set xtics 5
set ytics 5
set xlabel 'Current age'
set ylabel 'Years left (average)'
set grid
plot "life_table" using 1:3 title "Males" with lines linestyle 1, "life_table" using 1:5 title "Females" with lines linestyle 2
set key inside
gnuplot config1
config2:
set term wxt size 650,500 enhanced font "Sans,10" persist
set border lw 1
set style line 1 lc rgb "blue" lw 1
set style line 2 lc rgb "red" lw 1
set format x "%0.f"
set format y "%0.2f"
set xtics 5
set ytics 0.05
set xlabel 'Current age'
set ylabel 'Likelihood of death in next year'
set grid
plot "life_table" using 1:2 title "Males" with lines linestyle 1, "life_table" using 1:4 title "Females" with lines linestyle 2
set key inside
gnuplot config2
Last update: 2020-03-11
The blog posts on this website are licensed under a
Creative Commons Attribution-NonCommercial 4.0 International License