
For a full list of BASHing data blog posts see the index page. ![]()
VisiData: a table explorer for the terminal
The documentation for this new command-line program is exceptionally good. VisiData has its own project website with links and examples, a GitHub page, a YouTube video collection and a clear and concise man page. It also has an independently written and neatly organised tutorial website. Developer Saul Pwanson and documentation-builders Anja Kefala and Jeremy Singer-Vine have put a lot of effort into getting VisiData users up and going.
VisiData lets you quickly open, explore, filter and analyse tables of data, without leaving the terminal. The list of supported data formats is long and includes pandas and R data frames. VisiData also decompresses .zip, .gz, .bz2, and .xz archives on the fly.
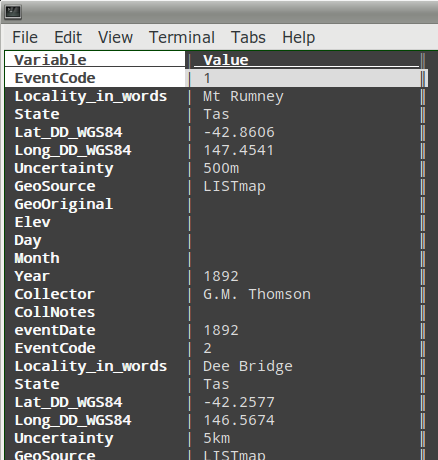
In the screenshot below I've opened the tab-separated table "events" with the command vd events in a small terminal window.

Columns are neatly separated, and truncated data items end with an ellipsis (...). Column widths are adjustable and the table is easily navigated with the expectable keys PageUp, PageDown, <, >, Home and End, with the header line "frozen". If that's all VisiData did, I'd be happy as Larry, because my occasional need for an overview of large, plain-text tables had previously pushed me out of the terminal into a GUI.
But VisiData can do a lot more, like ascending and descending sorts, filtering with regex, transposing rows and columns, building pivot tables and melting. Never heard of melting? Neither had I. It's building a new table with field names in the first column and data items in the second, for all rows in the table:
VisiData even allows you to save a command log and replay it, rather like a macro in a spreadsheet program.
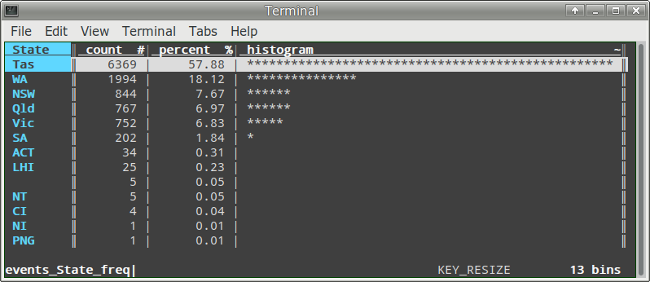
As a data auditor I routinely tally the unique data items in a field. VisiData does that, too, and adds percentage frequencies and a simple histogram:
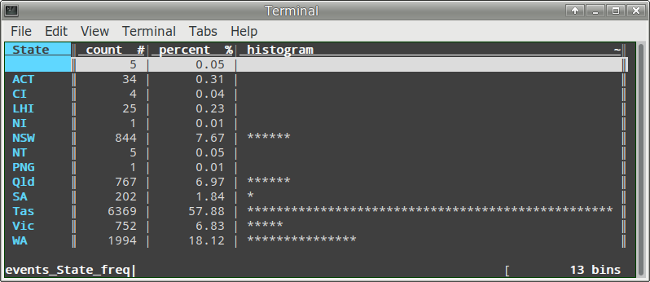
The default sorting is descending by count, but with a single keystroke ("[") you can change that to an ascending sort by data item:
and you can also do combined tallies from several columns at once.
Mentioning keystrokes brings me to what some users may find an obstacle to using VisiData. You can select rows and columns with a mouse, but almost every other operation is done from the keyboard using either single and combination keystrokes, or chains of keystrokes. My count could be wrong, but the man page seems to cover more than 100 different keystroke-driven operations. You definitely need to have a command cheatsheet handy, unless you do only a few VisiData operations and do them regularly.
Another operation I've tried is building graphs. Yes, VisiData does coloured scatterplots — but the graphs and axes aren't as good as those you can get using gnuplot in the terminal.
VisiData looks like a project to watch if you're a data worker. I'm using version 1.5.2.
Many thanks to reader Mike Poirier for pointing me to VisiData.
Last update: 2020-01-13
The blog posts on this website are licensed under a
Creative Commons Attribution-NonCommercial 4.0 International License